Sunday, 24 July 2016


Thursday, 7 July 2016
Room area Chart (Real time update)

PREPARATION:
Microsoft Excel 2013 and Dynamo Version 1.1.1.1841 or higher
WORKFLOW:
1. Launch Microsoft Excel 2013 and Create a Table similar to the following;
Microsoft Excel 2013 and Dynamo Version 1.1.1.1841 or higher
WORKFLOW:
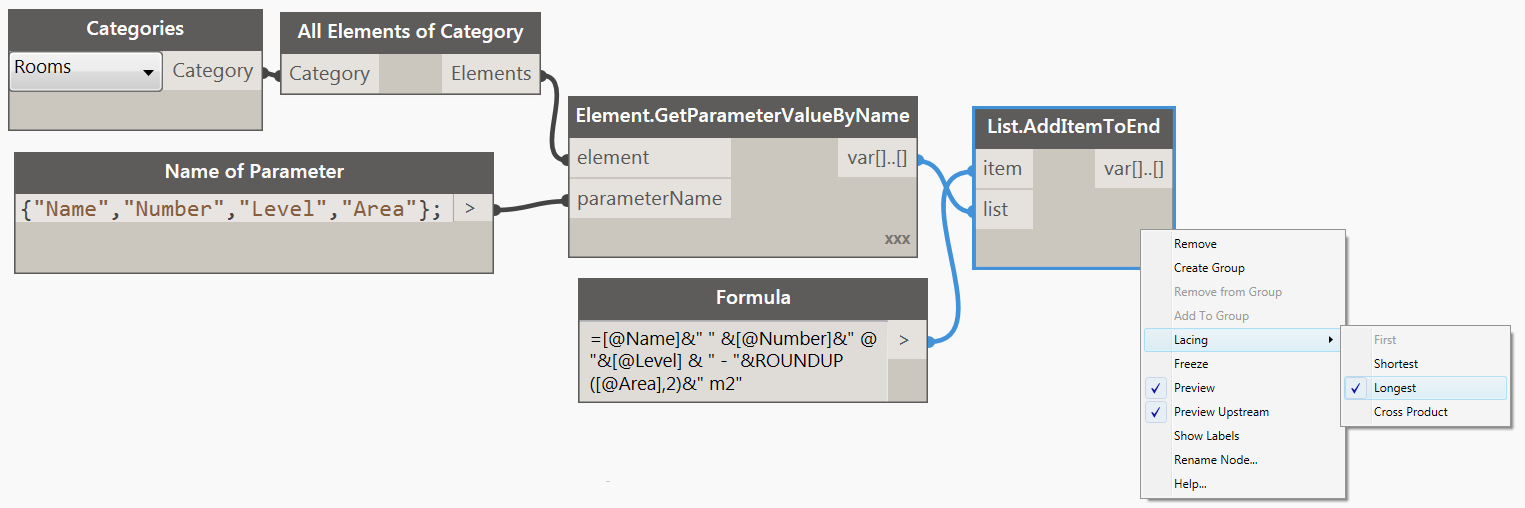
1. Launch Microsoft Excel 2013 and Create a Table similar to the following;


=[@Name]&" " &[@Number]&" @ "&[@Level] & " - "&ROUNDUP([@Area],2)&" m2"


You may visit for more here
Schedule on those view and schedule on Sheets in Revit using Dynamo
This video will show you that how you can Create A Sheet Schedule (Excel Native Format) Based On the Views and Schedules You Have Placed on Sheets in Revit Using Dynamo
Finished datasets here